It's no secret that topographic maps are packed with large amounts of information, but how much of it is actually useful? I’m not sure that when the USGS set out to gather data nationally they knew just how much of it was going to be used. Hundreds of people, organizations, and programs rely on it.
Each person uses the data found in topographic maps differently. It begs the question, is there a right or wrong way to use them? This might be a trick question, but let’s review some of the key features that users rely on.
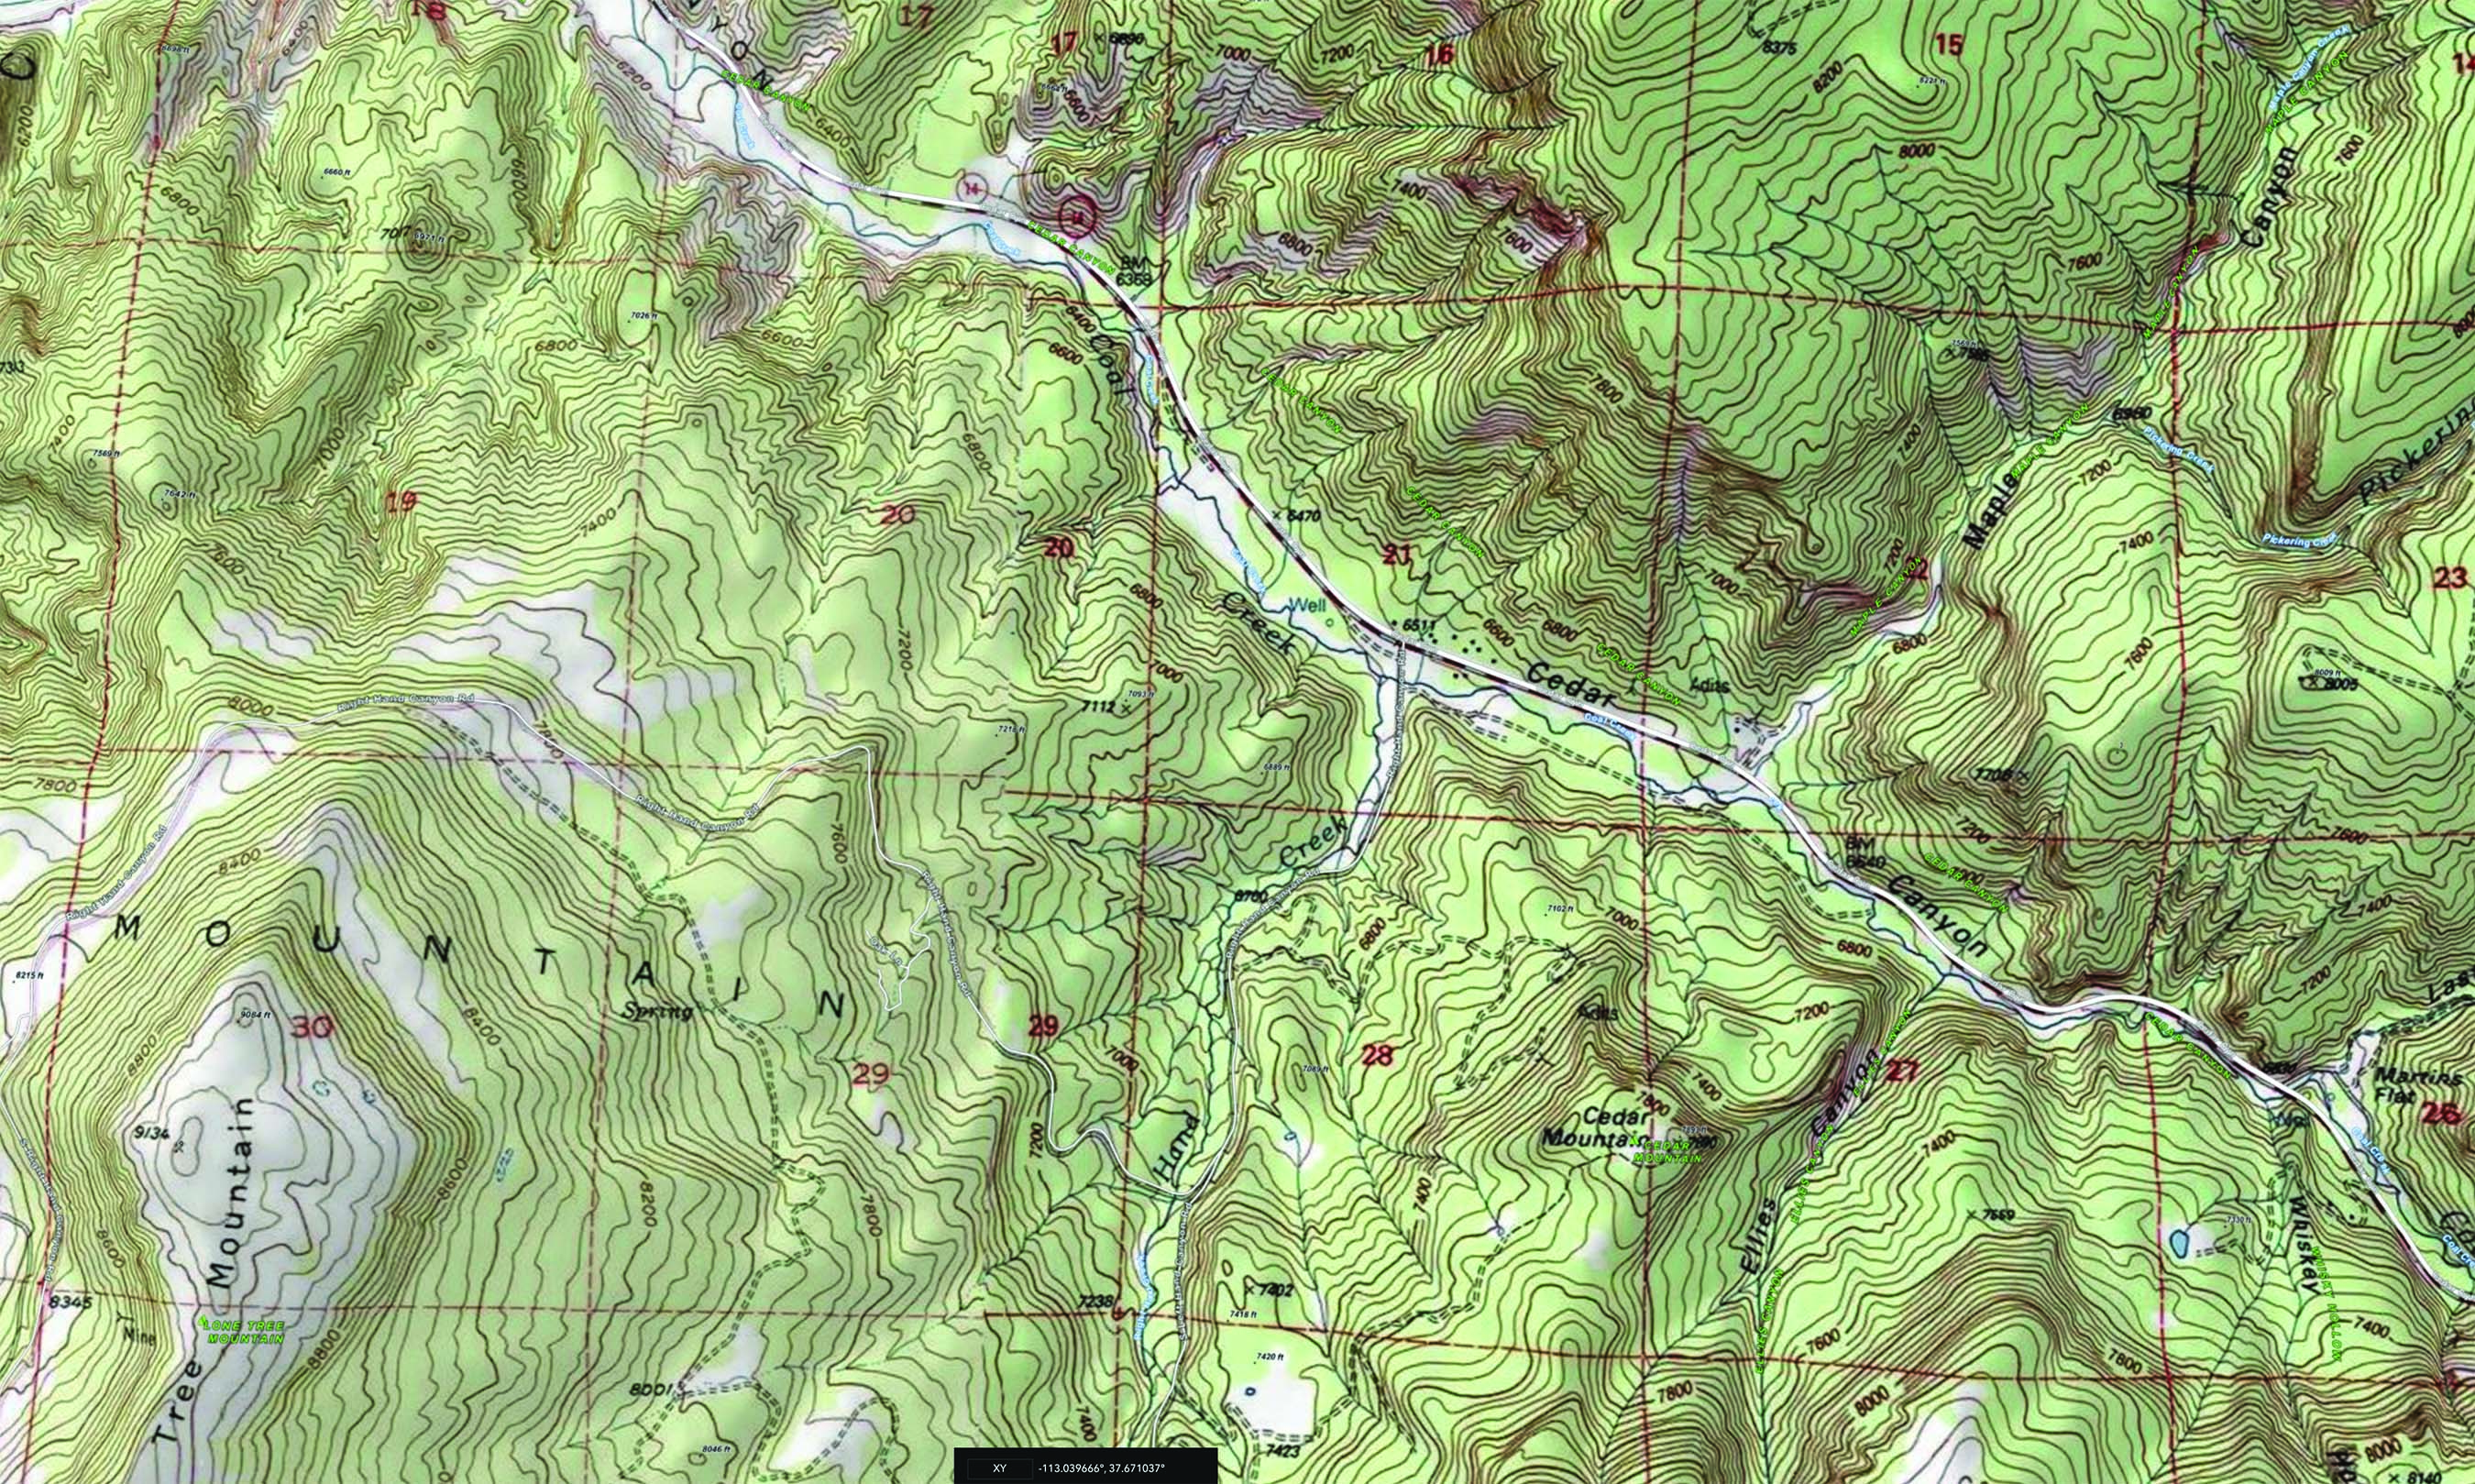
Topo maps represent features on the earth by differentiating symbology and labels. These along with separate colors distinguish the main classes of map features. Typically, the amount of data found on the maps depends on the map scale, the purpose of the map, and the cost of obtaining the information. Check out this link to the USGS Topo Map Legend https://pubs. usgs.gov/gip/TopographicMapSymbols/ topomapsymbols.pdf for more information on topographic maps and their symbols.
Features Shown on Topographic Maps
· Map delineation of topographic relief or “Contour Lines”
• Measurement
• Interpretation
• Contour interval
• Relief type
· Map representation of water features
• Classification of water features
• “Normal” water levels
• Linear watercourses
• Area water features
• Springs and wells
• Glacier and permanent snowfields
• Coastal line
· Manmade features
• Boundaries
• Travel and transportation routes
• Buildings
• Names, notes, and numbers
• Coordinate systems
· Information on map margins • Scale
• Orientation
• Responsibility
• Explanation
• Other data
· Map references
• Special selected list
• Legend
• North arrow