Have you ever wondered where or even how topographic maps came to be? Here’s a little history for you. Topographic maps were first invented by a man named John Wesley Powell. He was a geologist and Union army veteran. In 1884, he convinced Congress to authorize a cartography project. This painstaking project would first systematically create topographic maps to better understand hydrologic or water resources in the western U.S. landscape. This project was a serious undertaking. Surveyors had to do much of the measurement work by hand. They would use aneroid barometers to calculate altitude as well as steel tape measures and compass traverses for spatial distances. It was a tall order and very innovative at the time.
Contour lines depict what a true topographic map is. Surveyors would use the measurements and etch into huge sheets of copper that would later be used to print several of the first topographic maps. The project was a huge payoff and a success. It benefited not only the federal government, but it also continues to benefit us today.
Once you know the details, you can confidently read them. There are a few key things that you need to know and pay attention to. First, look at the scale of the map. This will tell you how much detail the map contains. The smaller the scale, the more detail the map will have. For example, a 1:24,000 scale map will have much more detail than a 1:100,000 map. Another key item to understand is the contour index, which are bolder topographic lines that make it easier to keep track of elevations. This can also be found in the map legend. The map legend will tell you what all the symbols represent.
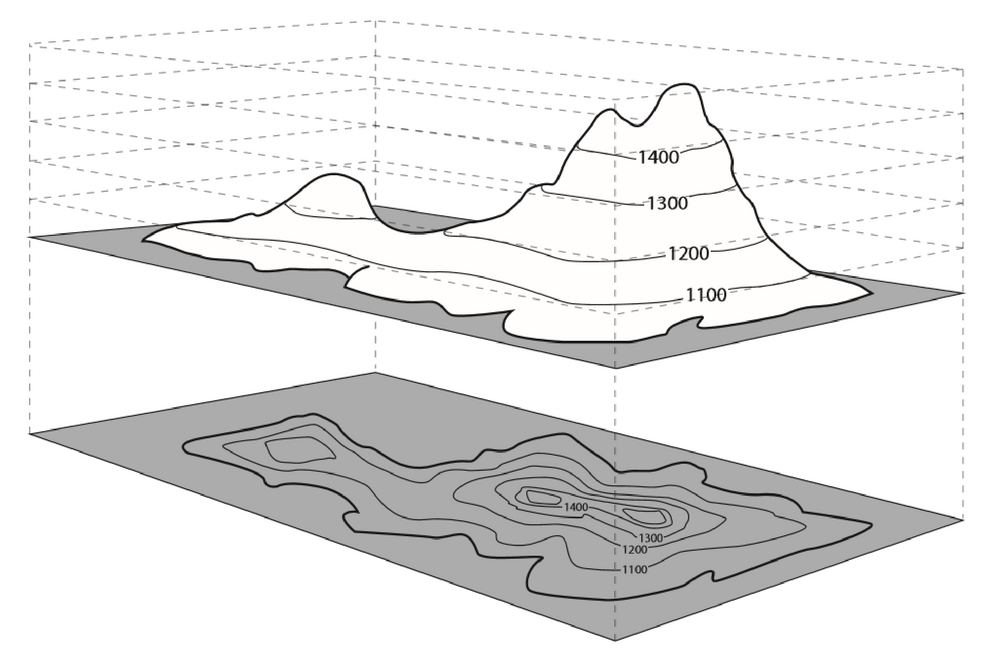
The key to topographic maps is being able to confidently read them. Contour lines on topographic maps will tell you most, if not all, of what is happening on the map. It will show you the following:
· Saddles – These are made up of contour lines that form an hourglass shape with rising lines on the sides.
· Ridges and Spurs – These are lines that form a V shape, pointing downward or downhill. This one is most common, but it is easily mistaken for the direction. Just remember that the V’s point downhill.
· Summits and Peaks – These are large circles with smaller and smaller circles within them. Peaks are shown with smaller inner circles.
· Cliffs – These are lines with extremely close or tight contour lines. This indicates that a sudden drop or rise in elevation occurs.
· Bowls – These are depicted by lines that form semicircles that rise from a low spot or point.
· Gullies, Valleys, and Ravines – These are lines in a U-shape pattern, almost looking like a rounded area. The sharper the U-shapes are, the steeper the area is.
The shapes described above are all made up of index lines, which are usually bolder than others, and supplementary lines, which are smaller, thinner lines. Combined, those will make up these shapes.
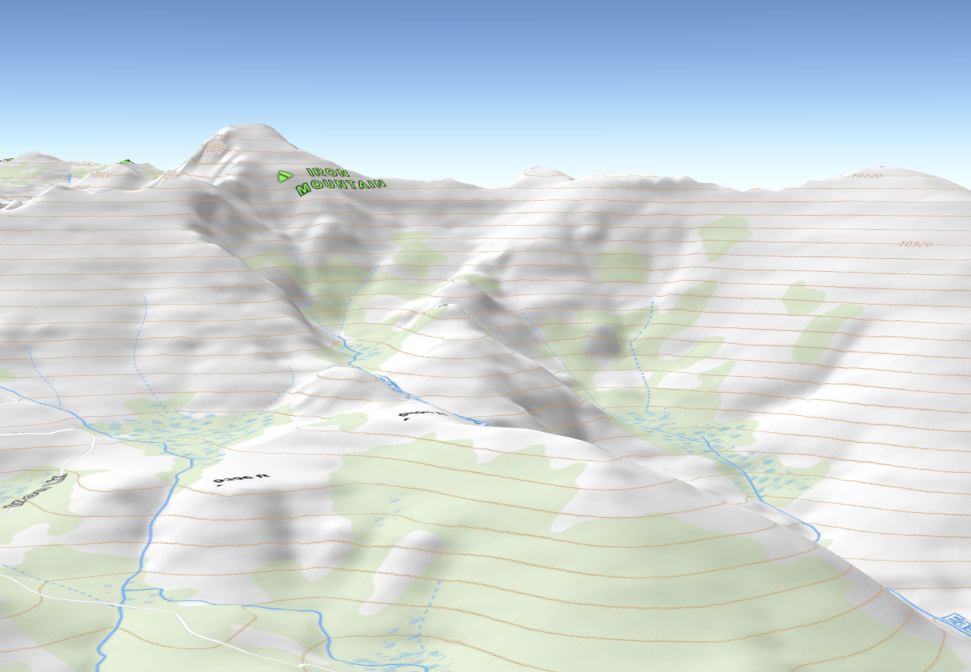
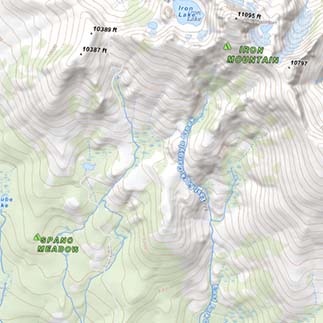
On the Huntin’ Fool 3-D map, we have included a couple different topographic maps that show the same information but are illustrated a bit differently. We added them to give you an opportunity to pick and choose as you are e-scouting. As always, you can find tutorial videos on our YouTube channel. Happy mapping!