Last month, we explored how 3D can enrich a user’s perspective when exploring online maps. Let's dive a little deeper and talk about map layers. A little side note, layers and how maps are represented is called Cartography. When I think of cartographers, I think of those mapping pioneers who hand- drafted stunning topographic maps. The most common ones are published by the USGS (United States Geological Survey). Those pioneers truly paved the way.
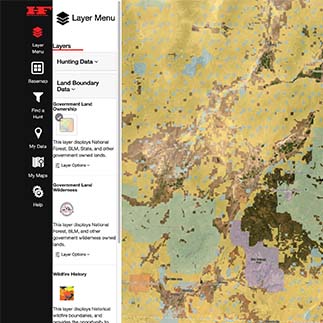
Technology has given modern cartographers the ability to enrich layers’ visibility into maps. Instead of dumping layers upon layers on top of each other, we needed to figure out what layers worked with each other the best. That may not seem too daunting, but it was a challenge. No one wants to constantly turn layers on and off to see their relationship with each other or visually filter the data. Let’s face it, garbage in is garbage out. I really had to find what layers would be beneficial to an e-scouter. It sounds good to list all of the layers a mapping application can cram in there, but what I found best was to find a way to allow the e-scouter to interact with the layers. The Hunt Planner does just that. We have built in our mapping platform the ability for e-scouters to filter the data. For example, we have a layer that shows 10+ years of fire history. In Huntin’ Fool’s video “5 Steps to E-Scouting,” Jerrod Lile demonstrates how to use the filtering tool. Check it out on our YouTube channel.
Let’s say as an elk hunter you know elk like 2 to 3-year-old burns. Fires do so much for our environment that not everyone can comprehend, but elk love it! Fires loosen up the soils and allow for new growth or vegetation to start growing. This will bring elk herds in. As an e-scouter on the Hunt Planner, you can filter down the data, including filtering the fire history by the year or the last two or three years. This filter will basically hide all the other years’ boundaries. Sounds pretty useful, right? Well, we took it a step further. You can even change the transparency to overlaying layers. This means you can use a slider to lighten the boundary or keep it a strong color. This makes it easier for e-scouters to see what is underneath the layer without having to turn it on and off all the time.
Just remember, we made it a goal to take layer management to the next level. We wanted to make the Hunt Planner the easiest mapping application you use, and hopefully the only one!
Be sure to go check out our Mapping Minutes on our YouTube channel.
SHORT LIST OF LAYERS:
